Article Title: BTC/USDT Analysis: Key Support Levels and Next Potential Move
Market Overview:
Bitcoin
 BTCBitcoincrypto
Market Cap
$1.33T
Rank
#1
24h Volume
$33.76B
Circulating
19.99M
Max Supply
21.00M
As of Feb 18
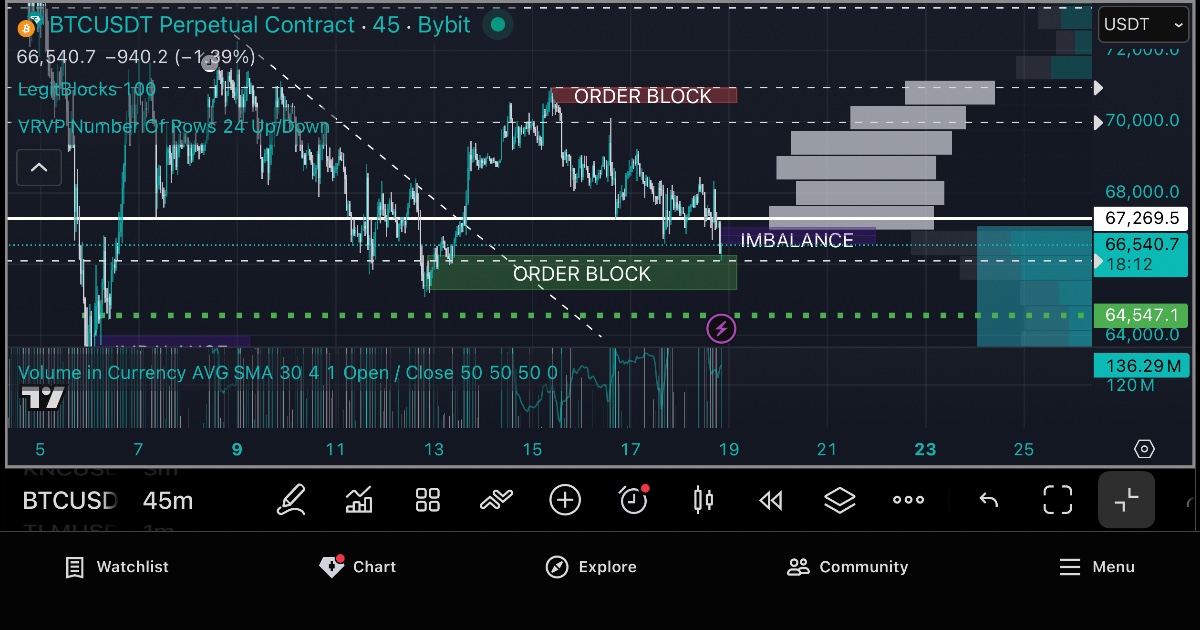
continues to show significant volatility as it tests crucial resistance levels. After a recent period of consolidation, the market is looking for a clear direction.
Technical Analysis:
1. Support and Resistance: The immediate support is currently sitting around the $65,000 mark. On the upside, Bitcoin needs to break and hold above $72,000 to confirm a bullish trend.
2. Indicators: The RSI (Relative Strength Index) is currently in the neutral zone, suggesting that there is room for a move in either direction. However, the MACD is showing signs of a potential bullish crossover on the 4-hour chart.
3. Volume: We are seeing steady trading volume, but a breakout will require a significant surge to sustain the momentum.
Prediction:
• Bullish Scenario: If BTC stays above the 20-day EMA, we could see a rally towards the next major target at $73,300. A decisive break above this level could open the door to $75,000 by the end of the month.
• Bearish Scenario: Failure to hold the current support level could lead to a retest of the lower boundary near $62,500. If selling pressure continues, we might see a further decline toward the $60,000 psychological support.
#BTC #Crypto #Trading #TechnicalAnalysis #Bitcoin #BTCUSDT
Written by Fox
I eat, sleep, and look at the chart.
Was this useful?
Share this article
Comments
No comments yet. Be the first to share your thoughts.
Sign in to read & comment